Solar overtakes coal in China’s installed capacity: reading the 2026 figures
At the end of July 2026 China had 1,286 GW of solar against 1,285 GW of coal. New PV additions in the first half fell by about two-thirds from 2025, while storage grew 61%. What this means for inverter and PCS makers.
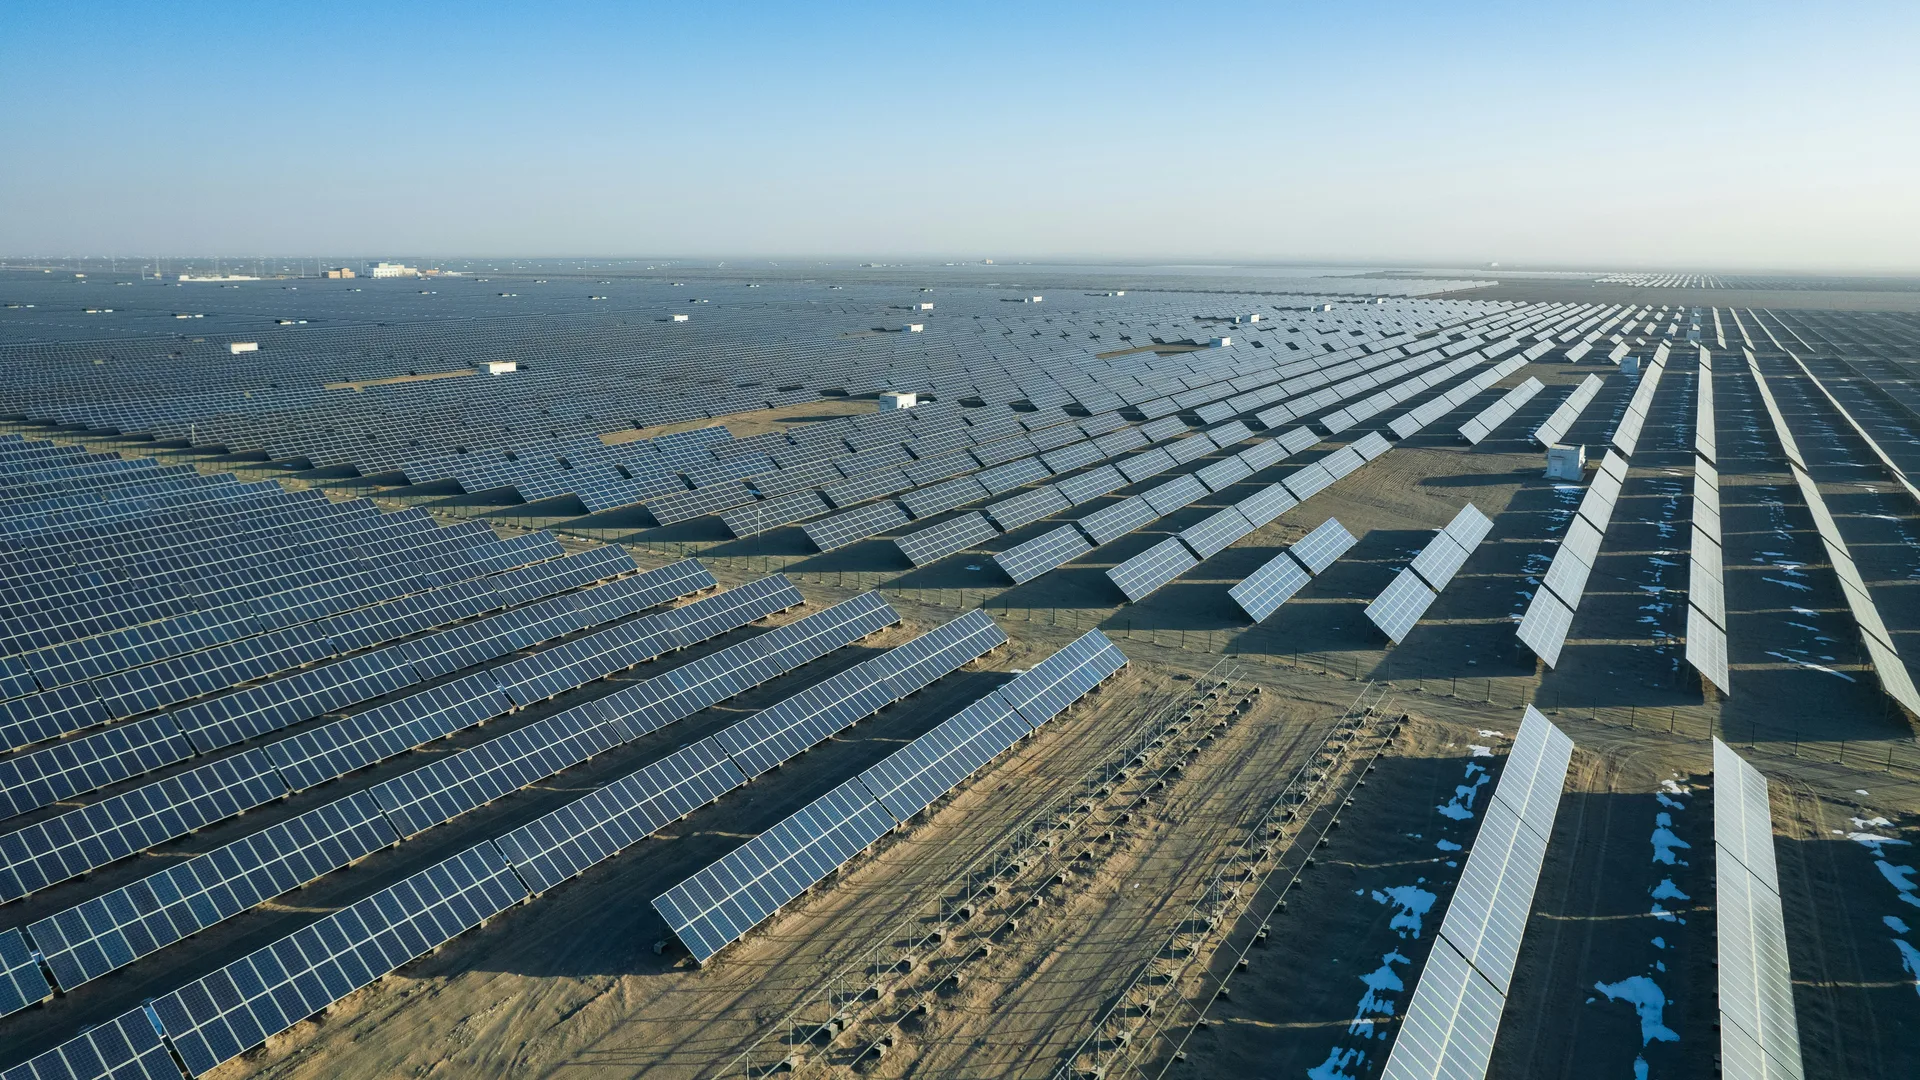
- 01End of July 2026: solar 1,286 GW, coal 1,285 GW. Solar is now the largest source by installed capacity, 31.5% of the total.
- 02Solar generated 802.4 TWh in January–July (+15.5%), about 13% of the total. Coal still generates the most.
- 03New PV in H1 2026: 71.77 GW, against 212 GW in H1 2025. Distributed PV made up 58.8% of this year’s additions.
- 04PV utilisation fell from 94% (H1 2025) to 91.4% (H1 2026). The grid now asks for output that can be dispatched and forecast.
- 05New-type energy storage reached 153 GW / 396 GWh at the end of June, up 61% year on year.
The figures
| Item | Figure | Period |
|---|---|---|
| Solar installed capacity | 1,286 GW | end of July 2026 |
| Coal-fired installed capacity | 1,285 GW | end of July 2026 |
| Solar share of total capacity | 31.5% | end of July 2026 |
| Solar generation | 802.4 TWh, +15.5% | January–July 2026 |
| New PV connected to the grid | 71.77 GW (centralised 29.55, distributed 42.22) | H1 2026 |
| New PV connected to the grid | 212 GW (centralised about 100, distributed 113) | H1 2025 |
| PV utilisation rate | 91.4% / 94% | H1 2026 / H1 2025 |
| New-type energy storage | 153 GW / 396 GWh, +61% | end of June 2026 |
Sources: National Energy Administration (NEA) press conferences and the NEA’s reprint of People’s Daily, 11 September 2026.
Capacity, not yet generation
The milestone is about installed capacity. In generation, solar supplied about one kWh in eight between January and July. Coal is still the largest generator, although its share of generation fell below 50% for the first time in the first half of 2026. During this summer’s peak, solar typically supplied more than 35% of midday output, according to State Grid data quoted in the same report.
Why new additions fell
The first half of 2025 was exceptional: 212 GW of PV was connected, and 317 GW over the full year. That peak coincides with the cut-off set by the NDRC and NEA pricing reform (Document No. 136): projects in operation before 1 June 2025 keep their existing price terms, while later projects sell into the electricity market, with a support price set by competitive bidding. The NEA does not attribute the 2026 slowdown to a single cause, but the timing matches.
Cumulative growth continues: China still had 1,272 GW of PV at the end of June, 15.8% more than a year earlier.
What it means for equipment makers
- Grid behaviour matters more than volume. Utilisation fell to 91.4%. The report calls for PV to move from “depending on the weather” to “dispatchable and predictable”. Grid-support functions in inverters, active and reactive power control, and pairing with storage are what grid-connection tests check.
- Distributed is the larger share. 42.22 GW of the 71.77 GW added in H1 2026 was distributed: rooftop, residential and commercial systems. These products are installed close to homes, so residential EMC limits and installation safety apply.
- Storage keeps growing. 153 GW at the end of June, and a target of 300 GW by 2030 in the 15th Five-Year plan for the new energy system. PCS makers face grid-connection, safety and EMC tests at higher volumes.
- Export markets weigh more. With domestic additions below the 2025 level, overseas markets take a larger share of sales. Each market has its own grid code and certification route, so one product often needs several test programmes.
FAQ
Has solar overtaken coal in electricity generation?
No. Only in installed capacity. Solar supplied about 13% of generation in January–July 2026. Coal is still the largest generator, though its share fell below 50% in the first half of 2026.
How much did new PV installations fall?
China connected 71.77 GW of new PV in H1 2026, against 212 GW in H1 2025: about two-thirds less. Cumulative capacity still grew 15.8% year on year.
What is the 1 June 2025 cut-off?
Under NDRC/NEA Document No. 136, projects in operation before 1 June 2025 keep existing price terms. Projects from that date sell into the market, with a support price set by bidding.
Sources
- NEA (reprinting People’s Daily, 11 Sep 2026): Solar becomes the largest power source by installed capacity
- NEA press conference: renewable grid connection in H1 2026
- NEA press conference: renewable grid connection in H1 2025
- NEA: renewable grid connection in 2025
- NDRC and NEA, Fa Gai Jia Ge [2025] No. 136: market-based pricing for new-energy power